• Skip to main content
  • Skip to footer

Low Carbon Kāpiti

Working together for local climate solutions

  • Home
  • About
    • T-Shirts
    • Resources
    • Affiliates
  • Campaigns
    • Don’t Burn Our Future
    • Urban trees campaign
    • Past campaigns
  • Contact
  • Join Us
  • Blog

New carbon footprint for Kāpiti District

By

New reports are out giving carbon footprint estimates for the Wellington Region and districts including Kāpiti from 2000-01 to 2018-19.

The headline figures give the change from 2000-01 to 2018-19 for each sector, the percentages beneath gives the size of the top emissions sources in the sector compared to the whole footprint.

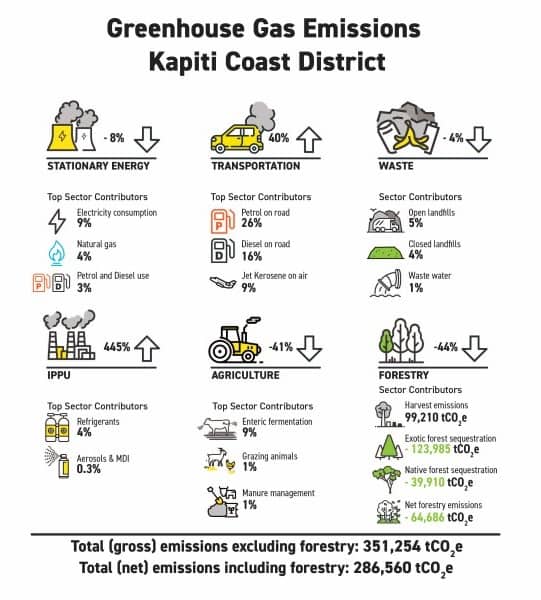
Kāpiti Coast District’s gross emissions (excluding forestry) rose by 11% over the period while the Region’s emissions declined by 5%. For Kāpiti, the largest increase over the period in absolute terms was from transport, which more than negated reductions in other sectors. Industrial processes and product use (IPPU) had a huge percentage increase but is still a small contributor overall. The full report can be found here: http://www.gw.govt.nz/research-shows-fall-in-greenhouse-gases-over-two-decades-but-a-worrying-rise-in-transport-emissions/

Filed Under: Uncategorized

Footer

Search

This website is brought to you with the support of Help Me Net.

Copyright © 2025 · Parallax Pro on Genesis Framework · WordPress · Log in